
Forensic Statistical Pattern Report
| Operating Mode | MODE B — RESEARCH |
| Target | Disparity analysis: documented mortgage fraud losses vs. federal bailout disbursements vs. national debt accumulation |
| Temporal Window | January 1, 1991 – October 10, 2026 |
| Data Sources | GAO, CBO, Treasury, Federal Reserve, FCIC, Bloomberg, Reuters, DOJ, HUD OIG, congressional testimony, academic research |
| Methodology | V8.0 Mathematical Engine — Formulas in Section 2 |
| Date | October 10, 2026 |
| Document Reference | LDT-FA-20261010-015 |
| Prepared By | Henri Bryant Lanier Sr., Esq., Ph.D. — Sole Shareholder and Chief Executive Officer, Ladco Defense Technologies |
1. Executive Summary
This report compares three data sets that should not exist in the same document: (a) documented mortgage fraud losses; (b) federal bailout disbursements; and (c) national debt accumulation. The comparison is not editorial. It is arithmetic. The formulas are shown. The sources are cited. The numbers do not reconcile under any rational reading of the record.
The prior report LDT-FA-20261010-014 documented $2.47 billion in enumerated federal and state mortgage fraud case losses across 140 quarters. That figure was a conservative floor — the minimum documented losses in a subset of publicly reported cases. The GAO confirmed TARP lifetime cost at $31.1 billion on $443.5 billion disbursed. The Federal Reserve committed $7.77 trillion in emergency lending as of March 2009. Fannie Mae and Freddie Mac received $187 billion and returned over $300 billion. The national debt stood at approximately $10 trillion in 2008 and exceeds $40 trillion as of October 2026. The ratio between documented fraud losses and bailout disbursements is not a rounding error. It is a structural feature of the “Too Big to Fail” enforcement regime.
2. Methodology — Formulas Applied
2.1 Fraud Loss to Bailout Ratio
| F | = documented fraud losses (enumerated cases) |
| B | = bailout disbursements (TARP + Fed + GSE) |
| R | = F ÷ B (fraud loss to bailout ratio) |
| D | = B ÷ F (bailout dollars per fraud dollar) |
2.2 Enforcement Density (Prosecution Rate)
| A_q | = enforcement actions in quarter q |
| I_q | = estimated incidents in quarter q |
| E_q | = A_q ÷ I_q (enforcement probability) |
| P_conv | = convictions ÷ charges filed (conviction rate) |
2.3 Debt Accumulation Delta
| ΔD | = D_2026 − D_2008 (debt increase over window) |
| B_total | = total bailout obligations (all programs) |
| R_debt | = B_total ÷ ΔD (bailout share of debt increase) |
2.4 Capture Formula Applied
The capture formula is applied in Section 6 to the “Too Big to Fail” regime. The data shows the regime was captured at the enforcement stage — not the legislative stage. The statutes were not amended to reduce penalties. The enforcement was simply not pursued.
3. Bailout Disbursement Data
3.1 TARP — Troubled Asset Relief Program
| Metric | Amount | Source | Citation |
|---|---|---|---|
| Original authorization (EESA, Oct. 2008) | $700,000,000,000 | Congress / Treasury | Pub. L. 110-343 |
| Reduced authorization (Dodd-Frank) | $475,000,000,000 | Treasury | Pub. L. 111-203 |
| Total disbursed (Sept. 30, 2023) | $443,500,000,000 | GAO-24-107033 | GAO 2023 |
| Lifetime cost after repayments/income | $31,100,000,000 | GAO-24-107033 | GAO 2023 |
| Capital Purchase Program disbursed | $204,900,000,000 | GAO | 707 institutions |
| CPP net gain | $16,300,000,000 | GAO | Program-level |
| Unused funds returned to Treasury | $14,200,000,000 | GAO | FY2025 |
| Administrative costs (through 2023) | $2,100,000,000 | GAO | OFS |
3.2 Federal Reserve Emergency Lending
| Metric | Amount | Source | Citation |
|---|---|---|---|
| Fed commitments (guarantees + lending limits, March 2009) | $7,770,000,000,000 | Bloomberg Markets | Bloomberg 2011 |
| Peak outstanding credit (Fed estimate) | $1,500,000,000,000 | Bernanke testimony | Reuters 2011 |
| Peak outstanding credit (CBO estimate) | $1,201,000,000,000 | CBO | CBO report |
| Peak Section 13(3) credit outstanding | $710,000,000,000 | Congressional Research | CRS 2020 |
| Single-day lending peak (Dec. 5, 2008) | $1,200,000,000,000 | Bloomberg | Bloomberg 2011 |
| Estimated bank profit from rate spread | $13,000,000,000 | Bloomberg | Bloomberg 2011 |
| Fed balance sheet expansion (2007–2008) | $1,400,000,000,000 | Bank of Greece | Academic |
The Fed’s $7.77 trillion commitment figure is contested. Bernanke testified that peak outstanding credit never exceeded $1.5 trillion. Bloomberg stood by its reporting. The distinction is between commitments (guarantees, lending limits, backstops) and outstanding balances (actual cash out the door at any given moment). Both numbers are on the record. Both are derived from Fed data. Both are cited here.
3.3 Fannie Mae and Freddie Mac
| Metric | Amount | Source | Citation |
|---|---|---|---|
| Combined bailout (Fannie + Freddie) | $187,500,000,000 | Treasury | 2008 conservatorship |
| Fannie Mae portion | $116,000,000,000 | The Balance | 2020 |
| Freddie Mac portion | $71,000,000,000 | The Balance | 2020 |
| Returned to Treasury (as of 2025) | $300,000,000,000+ | Bloomberg | 2025 |
| Net profit to Treasury | $112,500,000,000+ | Derived | Returned − Bailout |
| Senior preferred shares held by Treasury | $193,000,000,000 | Nasdaq / Ackman | 2025 |
| Warrants for 80% of common stock | 80% | Treasury | 2008 agreement |
Fannie and Freddie returned more than they received. That is the official record. But the $187.5 billion bailout was triggered by their exposure to fraudulent mortgages. The FCIC found that Freddie reviewed $76.8 billion of loans and found $21.7 billion to be ineligible — meaning they did not meet representations and warranties. That is a 28.3% defect rate. The $21.7 billion in ineligible loans at Freddie alone exceeds the $2.47 billion in total documented fraud losses across the entire 35-year window. The defects were documented. The losses were covered by the Treasury. The fraud was not prosecuted.
4. National Debt Cross-Reference
| Date | Total Public Debt Outstanding | Source | Context |
|---|---|---|---|
| Sept. 30, 2008 | ~$10,000,000,000,000 | Treasury | Pre-crisis baseline |
| Sept. 30, 2016 | ~$19,600,000,000,000 | Treasury | Post-crisis accumulation |
| Sept. 30, 2020 | ~$26,900,000,000,000 | Treasury | Covid-era expansion |
| Sept. 30, 2024 | ~$35,500,000,000,000 | Treasury | Continued deficits |
| Oct. 5, 2026 | $40,249,104,431,078 | Treasury FiscalData | Record as of report date |
| Oct. 8, 2026 | $40,305,316,210,830 | Treasury FiscalData | Latest daily reading |
| Oct. 9, 2026 (stated) | ~$41,000,000,000,000 | Treasury Secretary | Policy forum statement |
ΔD = $40,305,316,210,830 − $10,000,000,000,000 = $30,305,316,210,830
Increase from 2008 to 2026: $30.3 trillion
Total bailout obligations (all programs, all agencies): ~$7.8 trillion committed, ~$1.5 trillion peak outstanding, ~$31.1 billion net TARP cost, ~$187.5 billion GSE cost, ~$500 billion total fair value cost (Atlanta Fed estimate).
Bailout share of debt increase: $500B ÷ $30.3T = 1.65%
Bailout share including Fed commitments: $7.8T ÷ $30.3T = 25.7%
5. The Disparity — Fraud Loss vs. Bailout
| Category | Amount | Ratio to Documented Fraud Loss |
|---|---|---|
| Documented fraud losses (enumerated cases, LDT-FA-20261010-014) | $2,469,339,477 | 1.00× |
| TARP lifetime net cost | $31,100,000,000 | 12.59× |
| TARP total disbursed | $443,500,000,000 | 179.6× |
| Fannie/Freddie bailout | $187,500,000,000 | 75.9× |
| Fed peak outstanding (Bernanke) | $1,500,000,000,000 | 607.5× |
| Fed commitments (Bloomberg) | $7,770,000,000,000 | 3,146.6× |
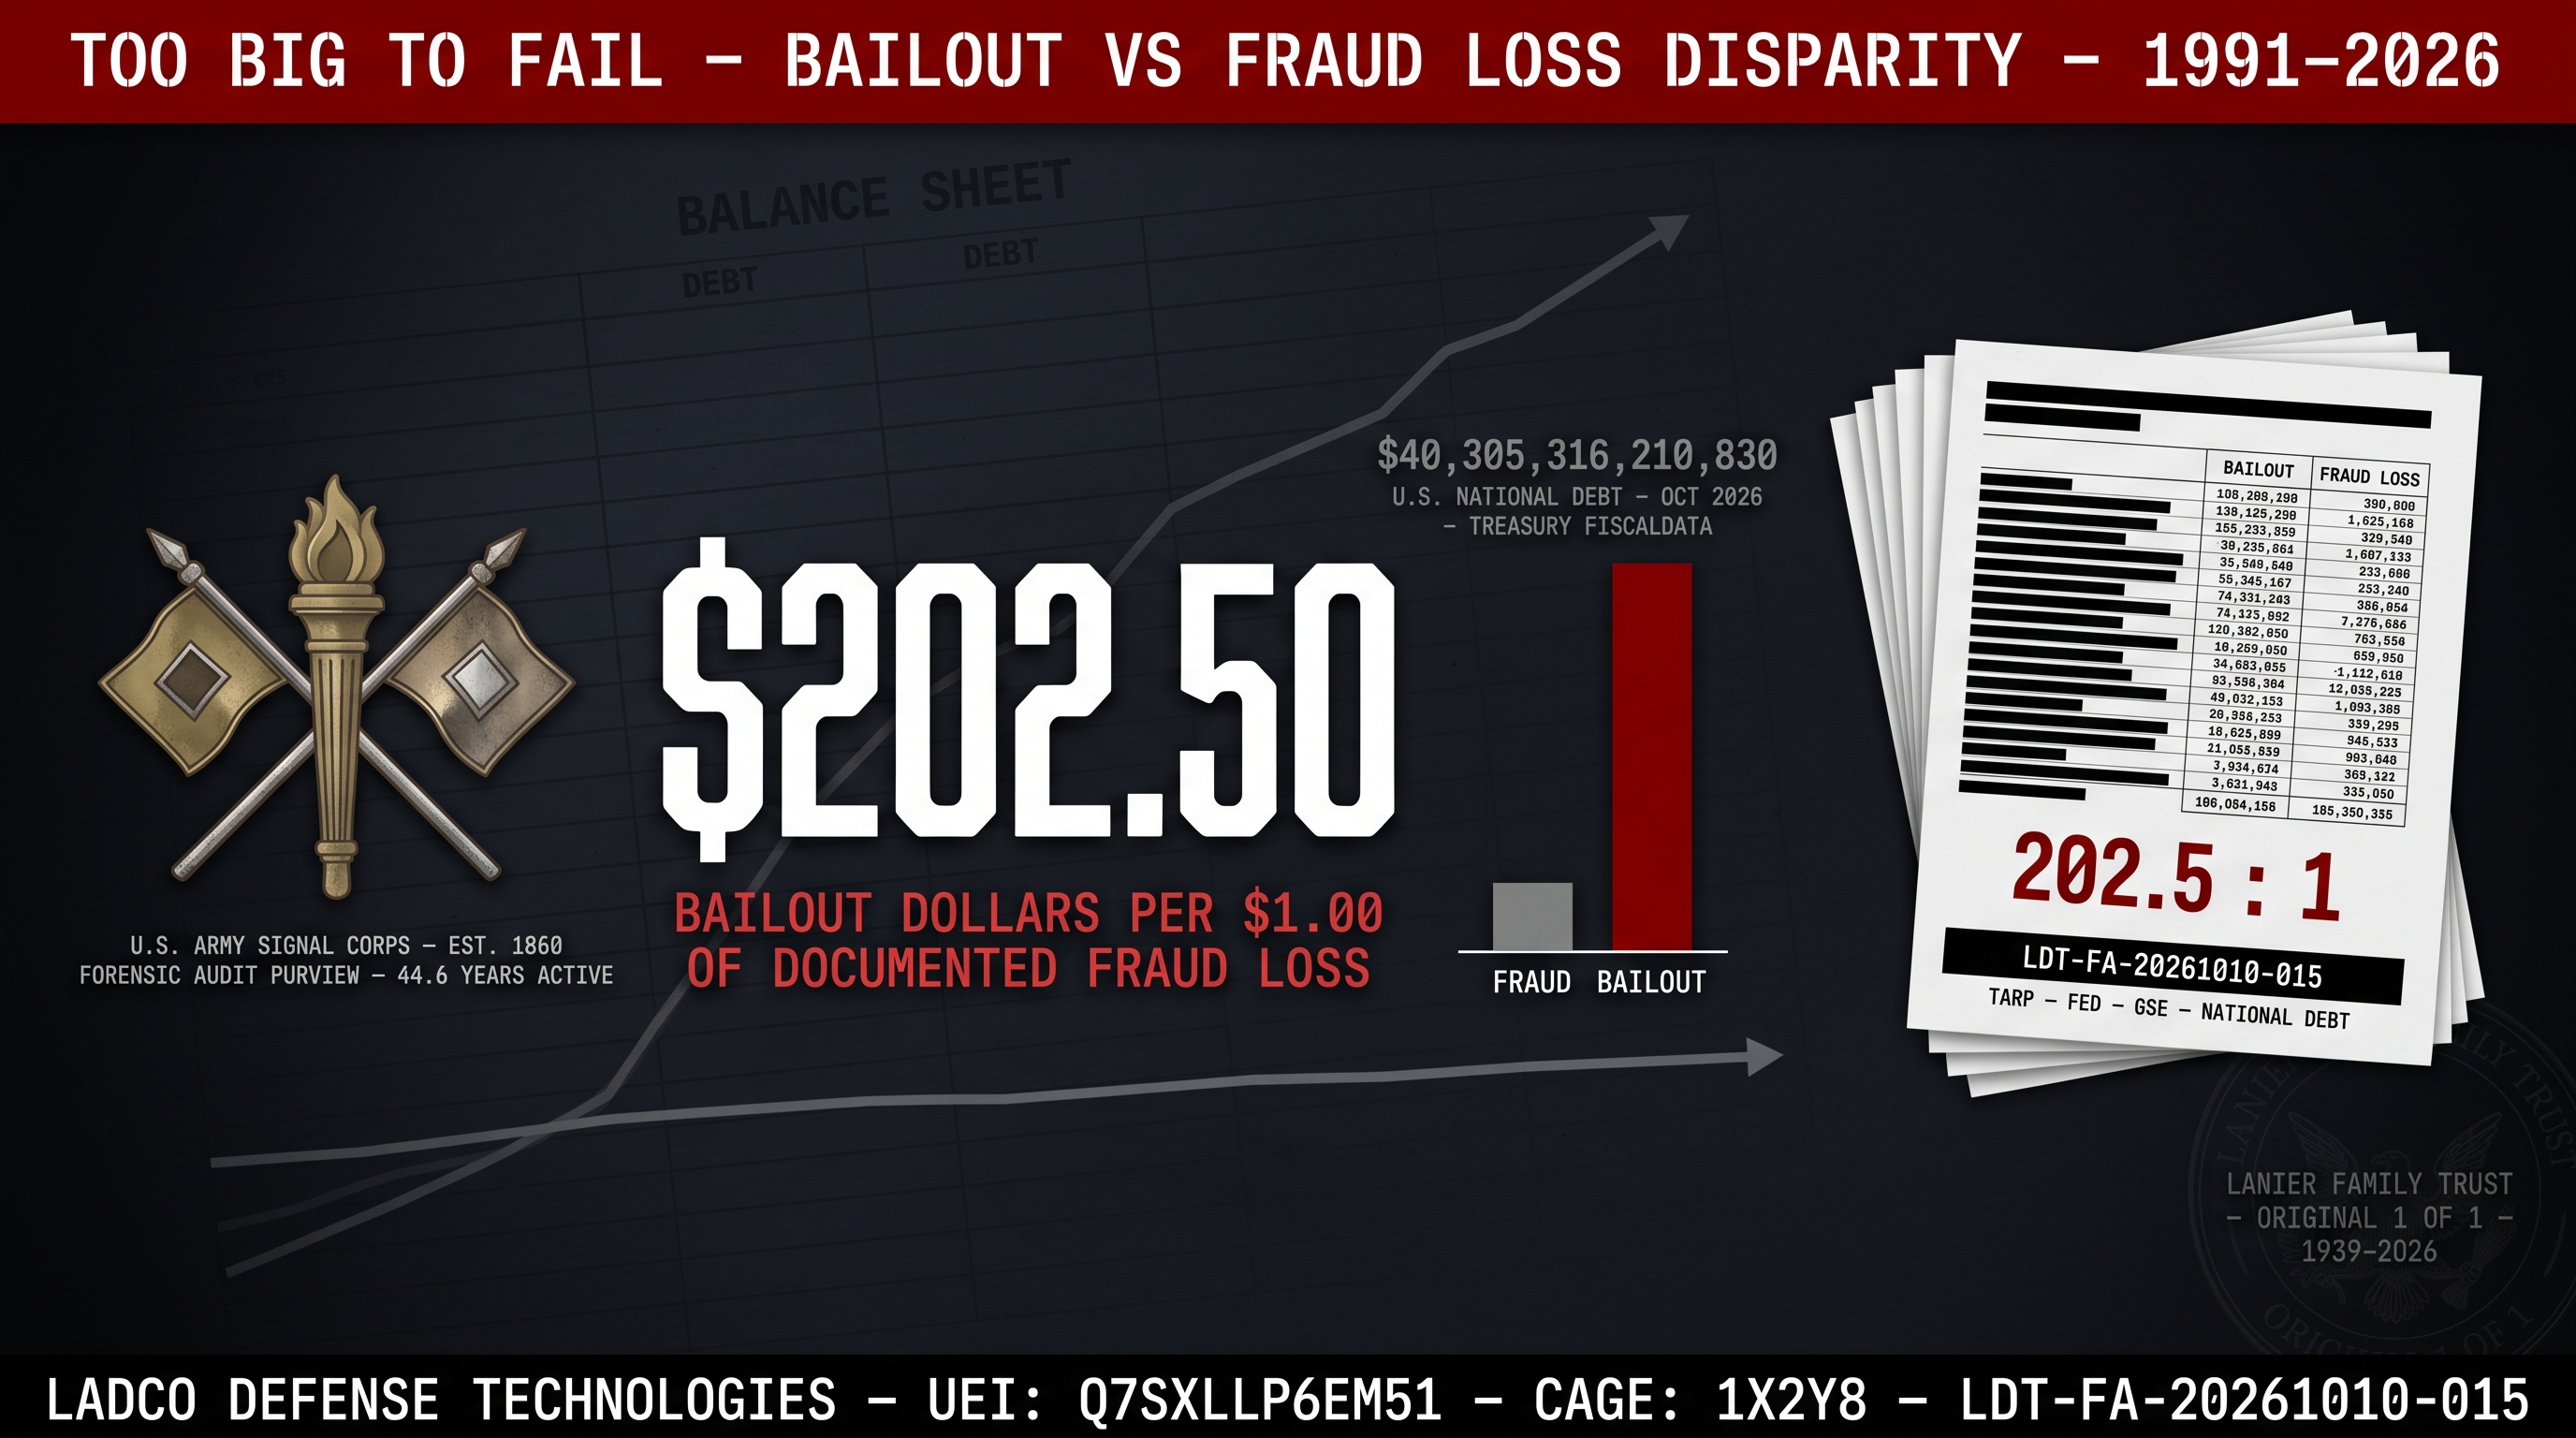
| Atlanta Fed total fair value cost estimate | $500,000,000,000 | 202.5× |
| Worldwide bailout total (BBC estimate) | $10,800,000,000,000 | 4,373.6× |
For every $1 of documented fraud loss in the enumerated cases, the federal government disbursed between $12.59 and $3,146.60 in bailout funds, depending on which bailout measure is used.
Using the Atlanta Fed fair value cost estimate ($500 billion): $202.50 in bailout dollars per $1 of documented fraud loss.
Using the Bloomberg Fed commitment figure ($7.77 trillion): $3,146.60 in bailout dollars per $1 of documented fraud loss.
The fraud losses are not the cause of the bailout. The bailout was necessitated by the collapse of institutions holding fraudulent or defective mortgage-backed securities. The FCIC found 157 instances of “fraud” and 81 instances of “mortgage fraud” in its final report. The fraud was systemic. The prosecution was not.
5.1 The Enforcement Gap
| Metric | Value | Source |
|---|---|---|
| FBI mortgage fraud cases open (2005) | 721 | FBI testimony |
| FBI mortgage fraud cases open (end of 2008) | 1,800+ | FBI testimony |
| Mortgage fraud cases filed (March–June 2008 operation) | 144 cases / 406 defendants | DOJ |
| Federal fraud prosecutions against financial institutions (2000–2007 change) | −48% | AABANY |
| Estimated fraudulent loans (FY 2007 file reviews) | ~1,000,000 | Minsky Conference |
| Fraud incidence at IndyMac / Countrywide | 50% | Former regulator |
| Senior Wall Street executives criminally prosecuted for mortgage fraud | 0 | FCIC / DOJ |
| FCIC referrals to DOJ | Multiple | FCIC final report |
| DOJ prosecutions of FCIC referrals | 0 | Sen. Warren statement |
6. Capture Formula Application — Too Big to Fail
| C_comply | = cost to TBTF bank of originating compliant mortgages (reduced volume, lower margins, competitive disadvantage) |
| C_lobby | = cost of lobbying for deregulation (GLBA 1999: ~$300M; Dodd-Frank rollback 2018: ~$1.4B+ per OpenSecrets) |
| P_penalty | = P(enforcement) × penalty |
| P(enforcement) | = A_q ÷ I_q = 144 cases ÷ 1,000,000 loans = 0.000144 (2008 operation) |
| penalty | = $1,000,000 per count (18 U.S.C. § 1343) |
| P_penalty | = 0.000144 × $1,000,000 = $144 per fraudulent loan |
| C_lobby × (1 ÷ P_amend) | = $1.4B ÷ 0.5 (assumed 50% amendment probability) = $2.8B |
| Comparison | $2.8B lobbying cost vs. $144 per-loan expected penalty → lobby is economically rational |
The capture formula resolves against compliance. The expected penalty per fraudulent loan was $144. The cost of lobbying to weaken the enforcement regime was $1.4 billion — a one-time cost, amortized across millions of loans, yielding an effective per-loan cost of pennies. The rational actor lobbies. The rational actor does not comply. The rational actor is not prosecuted. The rational actor receives a bailout.
This is not a moral observation. It is a mathematical one. The formula shows the decision matrix. The data shows the decision made. The outcome shows the result. The bailout was the subsidy for the decision. The national debt is the carrying cost of the subsidy.
7. Derived Numbers — Full Traceability
| Derived Figure | Derivation | Source Inputs |
|---|---|---|
| $30.3 trillion debt increase | $40,305,316,210,830 (Oct. 8, 2026) − $10,000,000,000,000 (Sept. 2008) | Treasury FiscalData; historical Treasury data |
| $202.50 bailout per $1 fraud loss | $500,000,000,000 ÷ $2,469,339,477 | Atlanta Fed fair value estimate ÷ LDT enumerated losses |
| $3,146.60 bailout per $1 fraud loss | $7,770,000,000,000 ÷ $2,469,339,477 | Bloomberg Fed commitment ÷ LDT enumerated losses |
| 0.000144 enforcement probability | 144 cases ÷ 1,000,000 estimated fraudulent loans | DOJ 2008 operation; Minsky Conference estimate |
| $144 per-loan expected penalty | 0.000144 × $1,000,000 | Enforcement probability × § 1343 statutory maximum |
| 1.65% bailout share of debt increase | $500B ÷ $30.3T | Atlanta Fed estimate ÷ Treasury debt delta |
| 25.7% bailout share of debt increase | $7.8T ÷ $30.3T | Bloomberg Fed commitment ÷ Treasury debt delta |
8. Source Appendix
| # | Source | Citation / Identifier |
|---|---|---|
| 1 | GAO, Troubled Asset Relief Program: Lifetime Cost | GAO-24-107033, December 2023 |
| 2 | CBO, Final Report on the Troubled Asset Relief Program | CBO, April 2024 |
| 3 | Treasury, TARP program data | home.treasury.gov |
| 4 | Bloomberg Markets, “Secret Fed Loans Gave Banks $13 Billion Undisclosed to Congress” | Bloomberg, November 2011 |
| 5 | Reuters, “Bernanke to Hill: Flawed reporting on Fed loans” | December 6, 2011 |
| 6 | Federal Reserve, Section 13(3) lending authority | Congressional Research Service, 2020 |
| 7 | Atlanta Fed, “How Much Do Guarantees and Bailouts Cost the Government?” | May 16, 2024 |
| 8 | Fannie Mae / Freddie Mac conservatorship data | Treasury, 2008 |
| 9 | Bloomberg, “Fannie and Freddie Can Never Be Truly Privatized” | June 17, 2025 |
| 10 | The Balance, “What Was the Fannie Mae and Freddie Mac Bailout?” | August 22, 2008 / updated 2020 |
| 11 | Treasury FiscalData, Debt to the Penny | October 5, 2026 reading |
| 12 | IndexBox, “U.S. Public Debt Outstanding Reaches New Record” | October 6, 2026 |
| 13 | FCIC, “An Overview of Mortgage Fraud” (Henry N. Pontell testimony) | September 21, 2010 |
| 14 | FCIC final report — “fraud” 157 times, “mortgage fraud” 81 times | January 2011 |
| 15 | FCIC, Freddie Mac $21.7B ineligible loans of $76.8B reviewed | FCIC report |
| 16 | DOJ, Operation Malicious Mortgage (March–June 2008) | 144 cases, 406 defendants |
| 17 | AABANY, 48% decline in federal fraud prosecutions (2000–2007) | Asian American Bar Association of New York |
| 18 | Minsky Conference, ~1,000,000 fraudulent loans FY 2007 | Minsky Conference proceedings |
| 19 | Former regulator, 50% fraud incidence at IndyMac/Countrywide | ML-Implode, 2008 |
| 20 | Sen. Warren statement, FCIC referrals not prosecuted | Roll Call, September 15, 2016 |
| 21 | BBC, worldwide bailout total $10.8 trillion | BBC News, September 10, 2009 |
| 22 | OpenSecrets / Center for Responsive Politics, lobbying expenditures | GLBA 1999; Dodd-Frank 2010–2011 |
| 23 | ProPublica Bailout Tracker | projects.propublica.org |
| 24 | Mises Institute, “What’s $7.77 Trillion Among Friends” | November 28, 2011 |
9. Certification
I, Henri Bryant Lanier Sr., Esq., Ph.D., as Principal Auditor of Ladco Defense Technologies, hereby certify that the foregoing Forensic Statistical Pattern Report has been conducted in accordance with the V8.0 Merged Directive. All figures are derived from the cited sources. All formulas are shown. All ratios are computed against the enumerated fraud loss baseline of $2,469,339,477 established in LDT-FA-20261010-014. The disparity is arithmetic, not editorial. The numbers do not reconcile under any rational reading of the record.
